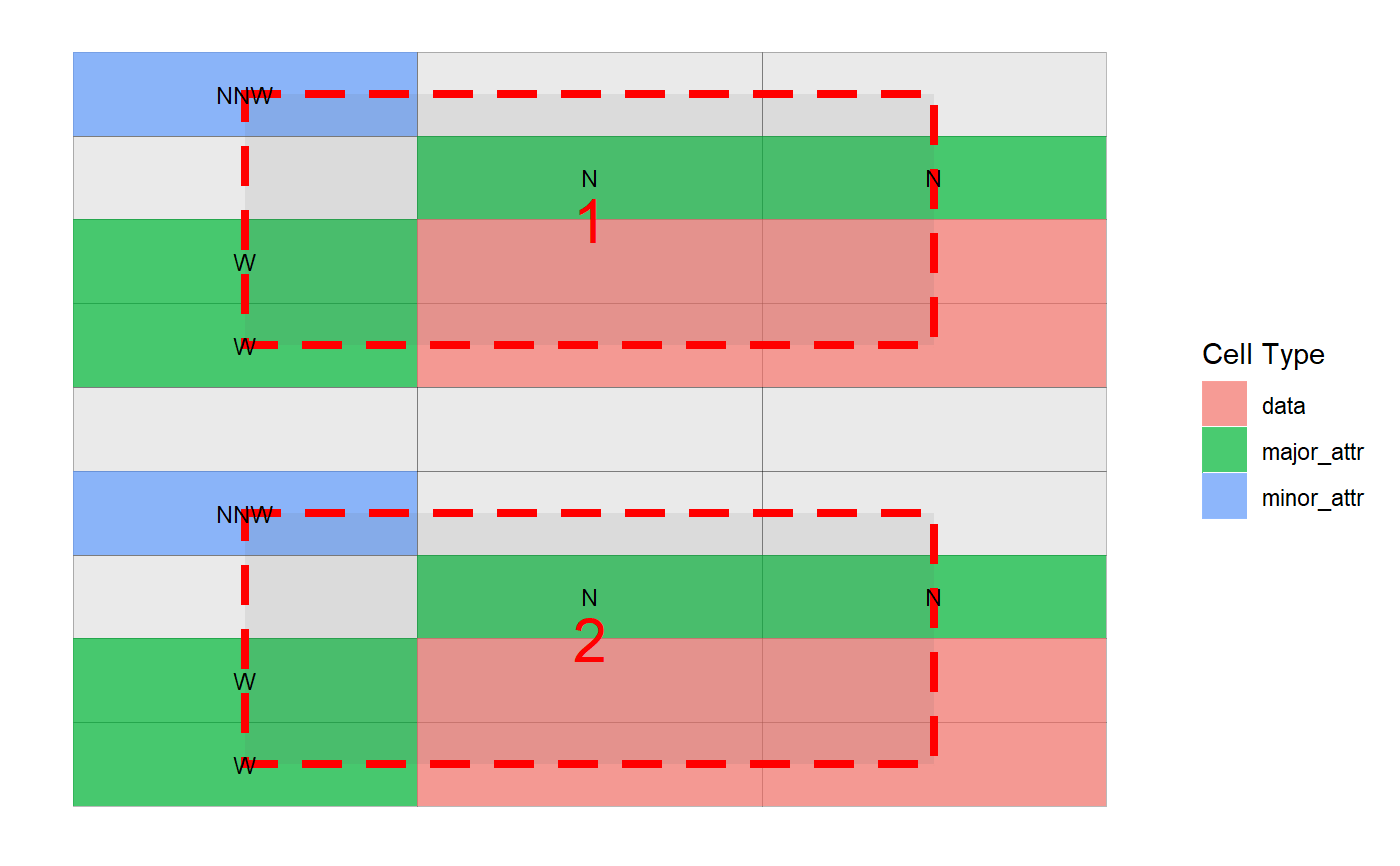
After Value Attribute Classification done on a cell_df next task to do is
analyze it's contents for data block detection, attribute orientation identification etc. The function analyze_cells (and also analyse_cells)
does the same for you.
Note:
If you are not sure about what package functions actually do or how they work together,
please start with vignette("tidycells-intro").
analyze_cells(d, silent = TRUE)
Arguments
| d | A |
|---|---|
| silent | logical scalar indicating whether to raise a warning if heuristic detection fails. (Default TRUE). |
Value
Detailed analysis of the cell data structure.
Which will be a cell_analysis class object.
Details
it returns detailed analysis of the data structure including data block detection, attribute orientation detection etc.
The argument silent is set to TRUE by default, as the warning will be given whenever the cell_analysis is printed.
After this step one may like to do :
If in an interactive session, following additional functions can be helpful for interactive visualizations:
See also
Examples
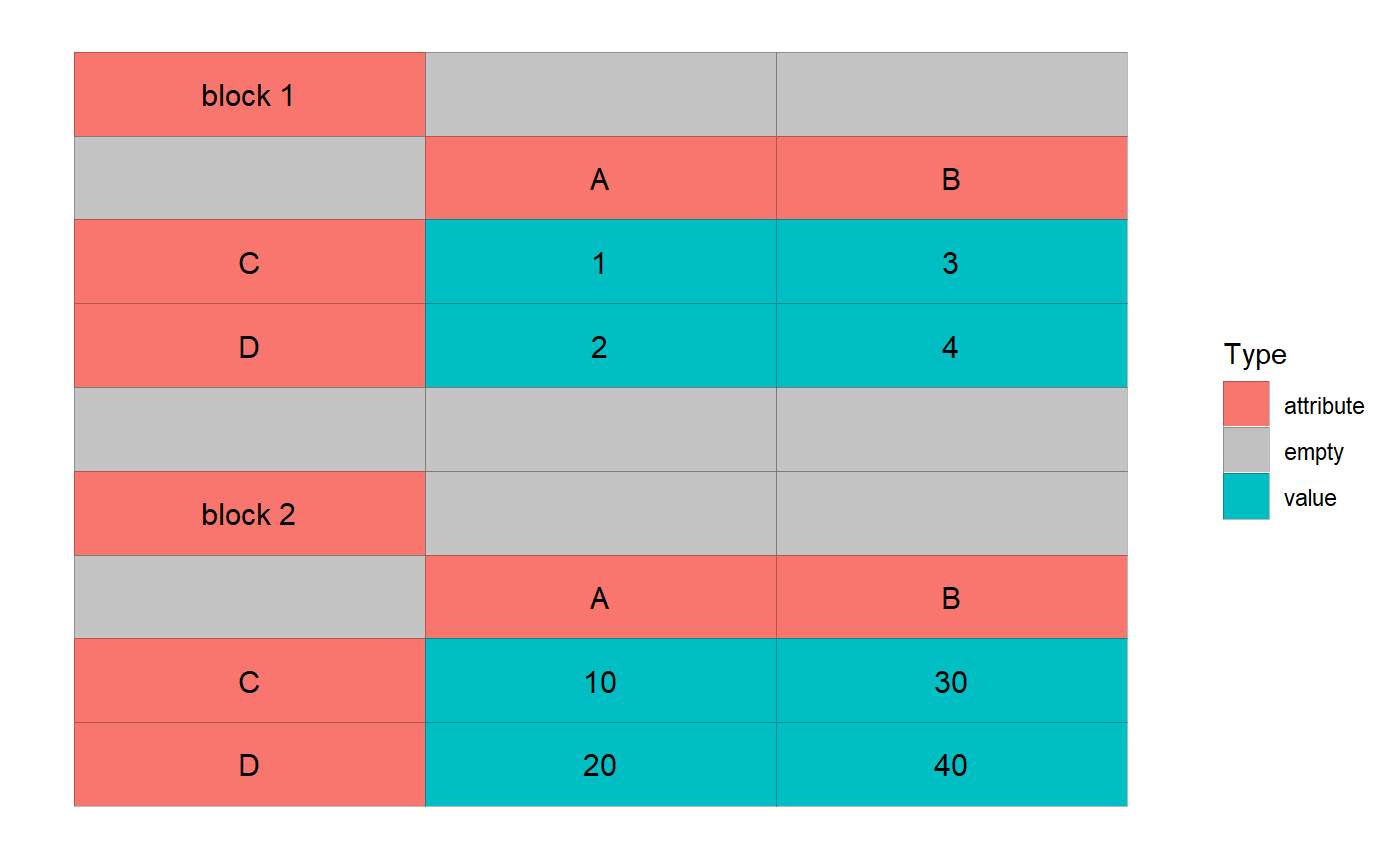
d <- structure(c( "block 1", "", "C", "D", "", "block 2", "", "C", "D", "", "A", "1", "2", "", "", "A", "10", "20", "", "B", "3", "4", "", "", "B", "30", "40" ), .Dim = c(9L, 3L)) d <- as.data.frame(d) cd <- as_cell_df(d) %>% numeric_values_classifier() # see it cd %>% plot(adaptive_txt_size = FALSE)